TrackSTAR Built-in Features
Trackstar Built-ins provide a comprehensive suite of features designed to streamline operations, enhance data-driven decision-making, and improve overall efficiency. By leveraging interactive floorplans, live data dashboards, and robust data import/export capabilities, users can gain real-time insights into their operations, optimize resource allocation, and eliminate waste. The system's trigger wizard and paperless forms automate key processes, boosting productivity and reducing manual errors. With advanced reporting and user-defined roles, organizations can tailor the system to their specific needs, ensuring data security and compliance while gaining a significant competitive edge through informed strategic decisions.
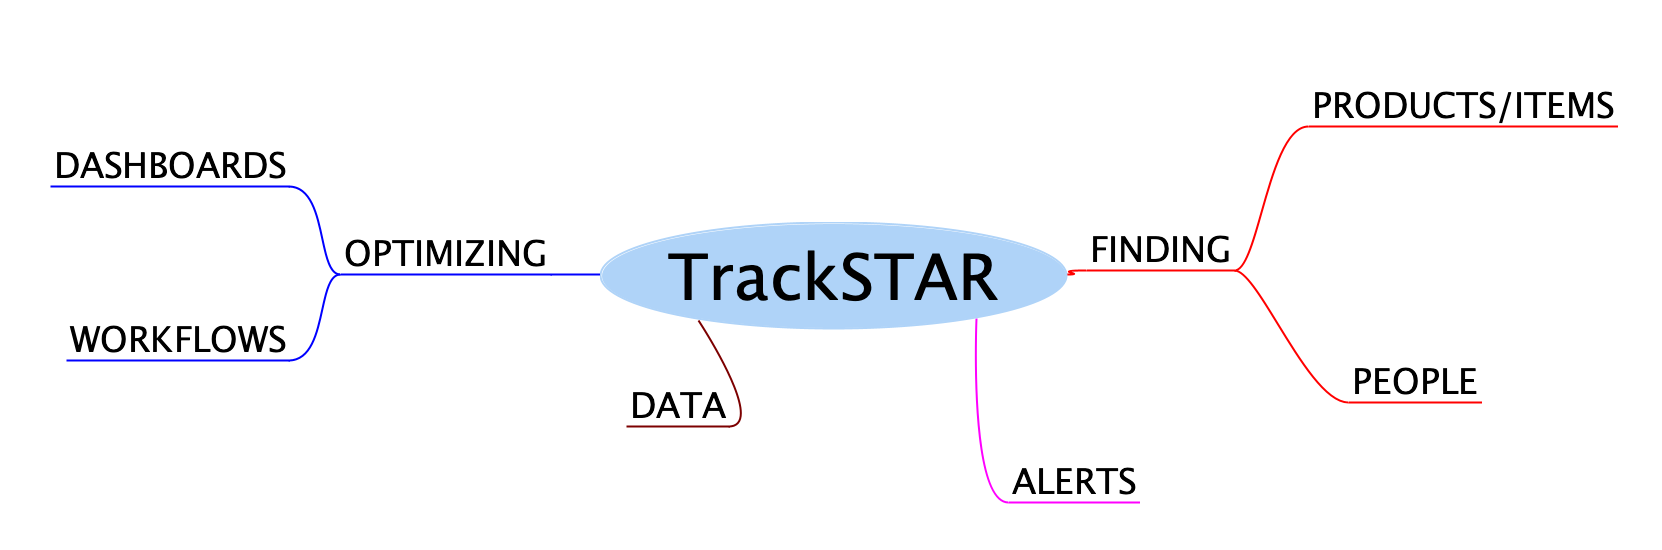
To illustrate how TrackSTAR empowers organizations with these powerful features, the mind map below breaks down its core capabilities—highlighting how it drives efficiency through dashboards, workflows, data insights, alerts, and precise tracking of products, items, and people.
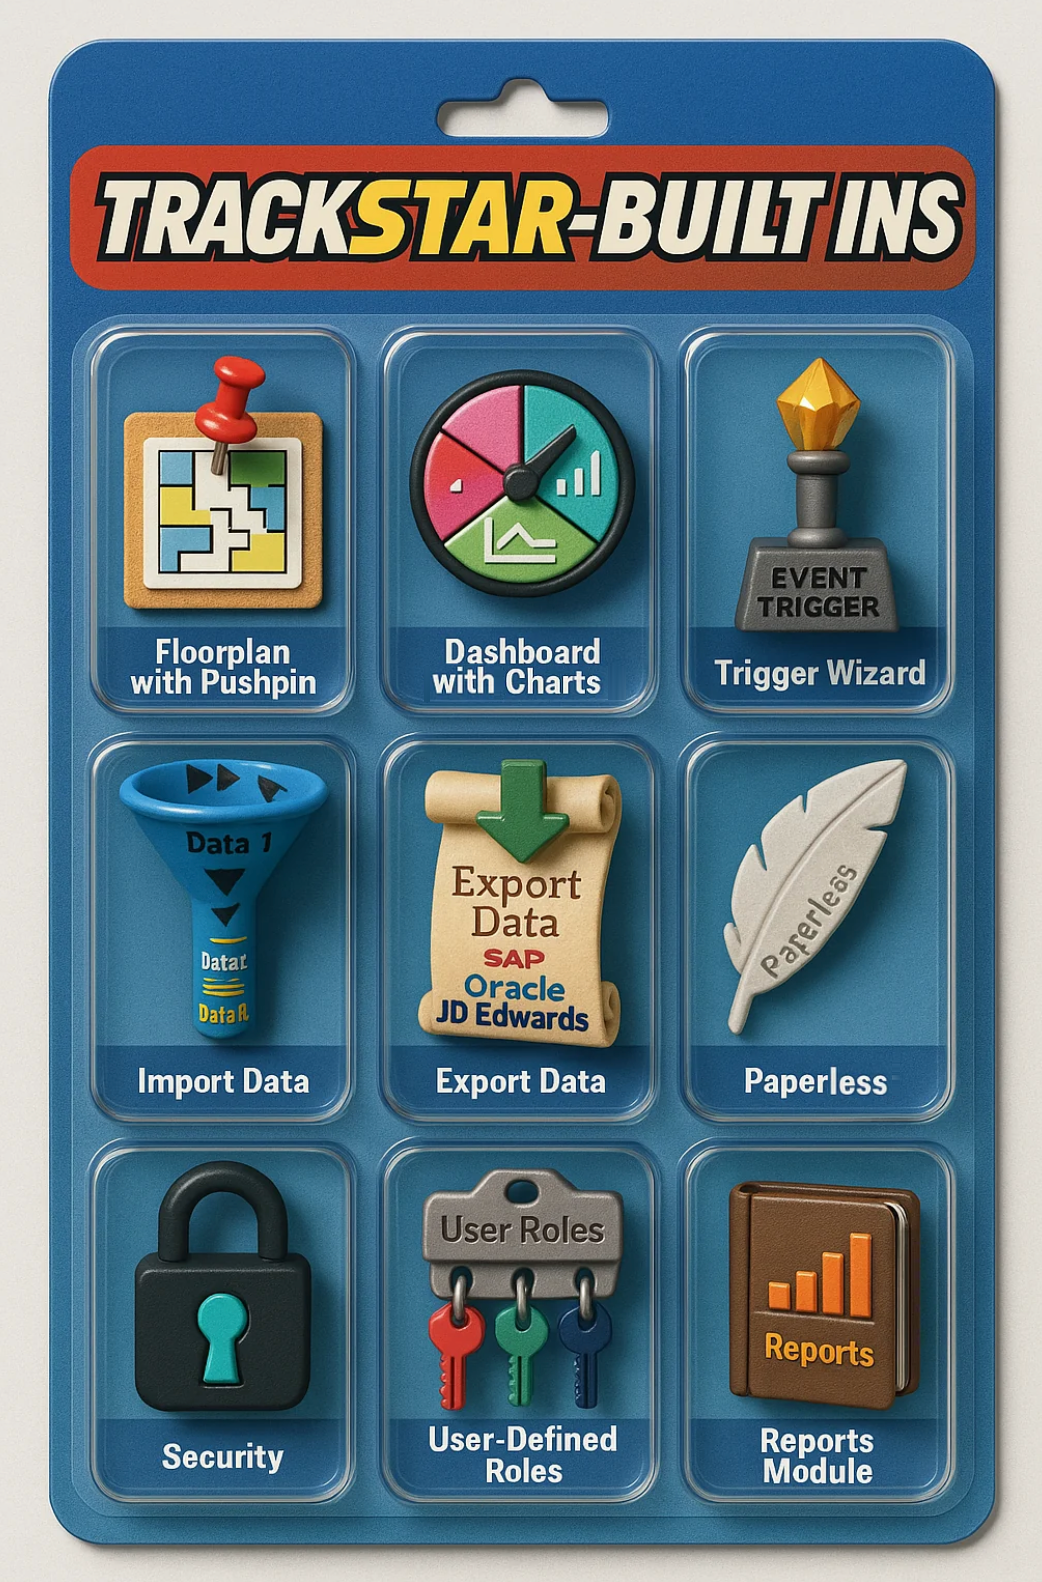
To truly understand the transformative potential of TrackStar for your organization, let's explore its nine core components.
Visualization & Monitoring
Real-time visibility and interactive data displays
Floorplan with Pushpin
Imagine a digital map of your space. You can place markers (pushpins) on it to represent assets or items. These markers are not static; they can show you real-time information about the asset, like its current status or details, using pop-ups. The map updates live, so you always see the most recent information.
- Supports interactive SVG or image-based floorplans with geodetic coordinate-based pushpin placements.
- Pushpins are dynamically linked to asset metadata or live status indicators via tooltips or modals.
- Real-time updates using WebSockets and polling to reflect changes in asset location or status.
Dashboard with Charts
Think of a control panel showing you important data visually. We use charts and graphs that you can interact with. These charts show live real time situational awareness and may be filtered to see specific user defined information.
- Utilizes advanced charting libraries for interactive visualizations.
- Charts are bound to live data feeds, with support for filters and drill-downs.
- Responsive design ensures usability across devices, with export options.
Data Management & Workflow
Data handling and process automation tools
Import Data
You can bring in data from files like spreadsheets or other formats. Our system checks the data to make sure it's correct and helps you match it to our system's data structure.
- Multiple formats with schema validation
- Mapping UI aligns incoming data fields
- Background processing with progress indicators
Export Data
You can take data out of our system in various formats, such as spreadsheets or PDFs. If you use SAP, our system can directly sync data with it.
- Multiple formats with customizable field set
- Native SAP integration for syncing
- Webhooks and scheduled jobs for integration
Trigger Wizard
This is like setting up automatic actions. You can create rules that trigger events based on specific conditions or schedules.
- Rule-based engine for events/thresholds
- GUI-based wizard with validation
- Supports notifications, API calls, updates
Paperless
We have a tool to create digital forms, similar to paper forms but online. These forms can include signatures and checks to ensure the information is entered correctly. They save automatically, keep a history of changes, and can be stored in cloud services.
- Digital form builder with signature support and input validation
- Auto-save and version history for editable forms and documents
- Integration with cloud storage or document management systems (e.g., SharePoint, Dropbox)
Administration & Governance
System controls, access management, and analytical tools
Reports Module
You can create custom reports with an easy-to-use builder. You can arrange data, group it, and format it to your needs. These reports can be saved as PDFs, Excel files, or web pages, and they can be automatically sent via email or other methods.
- Customizable report builder with drag-and-drop elements and scheduling
- Supports data grouping, aggregation, and conditional formatting
- Output to PDF, Excel, or HTML with automatic distribution via email or API
User-Defined Roles
You can set up different roles with specific permissions. This allows you to control who can access and do what in the system. It's easy to manage these roles and permissions through a simple interface.
- Role-based access control (RBAC) with granular permission assignment
- Admin UI for managing roles, permissions, and user associations
- Inheritance and policy rules to simplify complex access scenarios
Security
We take security seriously. Our system uses standard methods to protect your data, like strong authentication and encryption. We also keep logs of all activities for auditing and regularly assess our security to prevent any issues.
- Implements industry-standard authentication (OAuth2, SSO, MFA) and encryption
- Audit logs track user actions, data changes, and access history for compliance
- Periodic security assessments, role-based access, and protection against common vulnerabilities